

RSI Divergence
Probably the most reliable way to use the RSI indicator is through divergence. RSI divergence is when the price and the RSI starts trending in the opposite directions. This signals a loss of momentum in the directional movement of the asset which very often lead to a temporary change in direction.
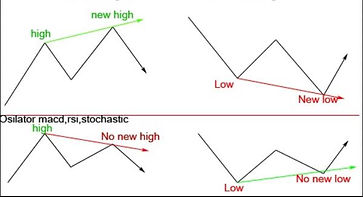
The proper way of assessing this divergence is measuring the corresponding RSI tops when the price is uptrending. A divergence has occured when the RSI fails to make a new high as the price does. Likewise, when the price is downtrending, a divergence has occured when the RSI fails to make a new low as the price does. See illustration on the right.
Sample Trades:
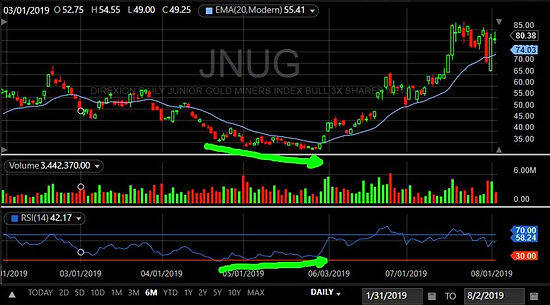
JNUG
On the left, you can see a divergence form on JNUG starting the beginning of May 2019 up to almost June 2019. This divergence resulted in a massive spike and actually changed the trend direction.
RSI divergence often leads to a temporary bounce, but it's far more uncommon to see a complete change in the overall direction of the price trend.
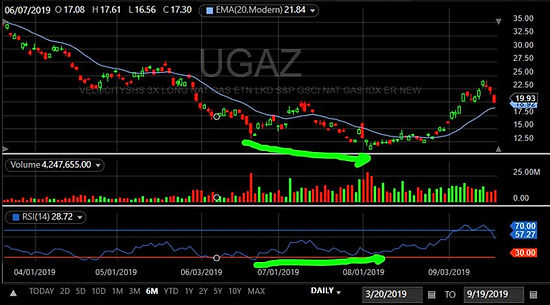
UGAZ
On the right, you can see a divergence form on UGAZ starting from the middle of June 2019 up to the beginning of August 2019. This divergence resulted in a significant spike and may actually result in an overall trend change.
With these leveraged ETFs, it is common to see at least a 30% bounce from bottom to peak after a divergence has occured.
Source(s): Technical Analysis of Stock Trends (Edwards & Mage, 1948); Bing Images: RSI Divergence; Wikipedia: RSI, Wilder; YouTube: RSI Divergence
RSI divergence is a valuable tool especially for counter-trend traders. It is not always advisable to trade against the trend. But using divergence, you can trade against the trend with a fairly high rate of success.
For more info on RSI divergence, check out these YouTube videos: